Welcome to this December adventure, where I write about the process of our latest game, Devils on the Moon pinball.
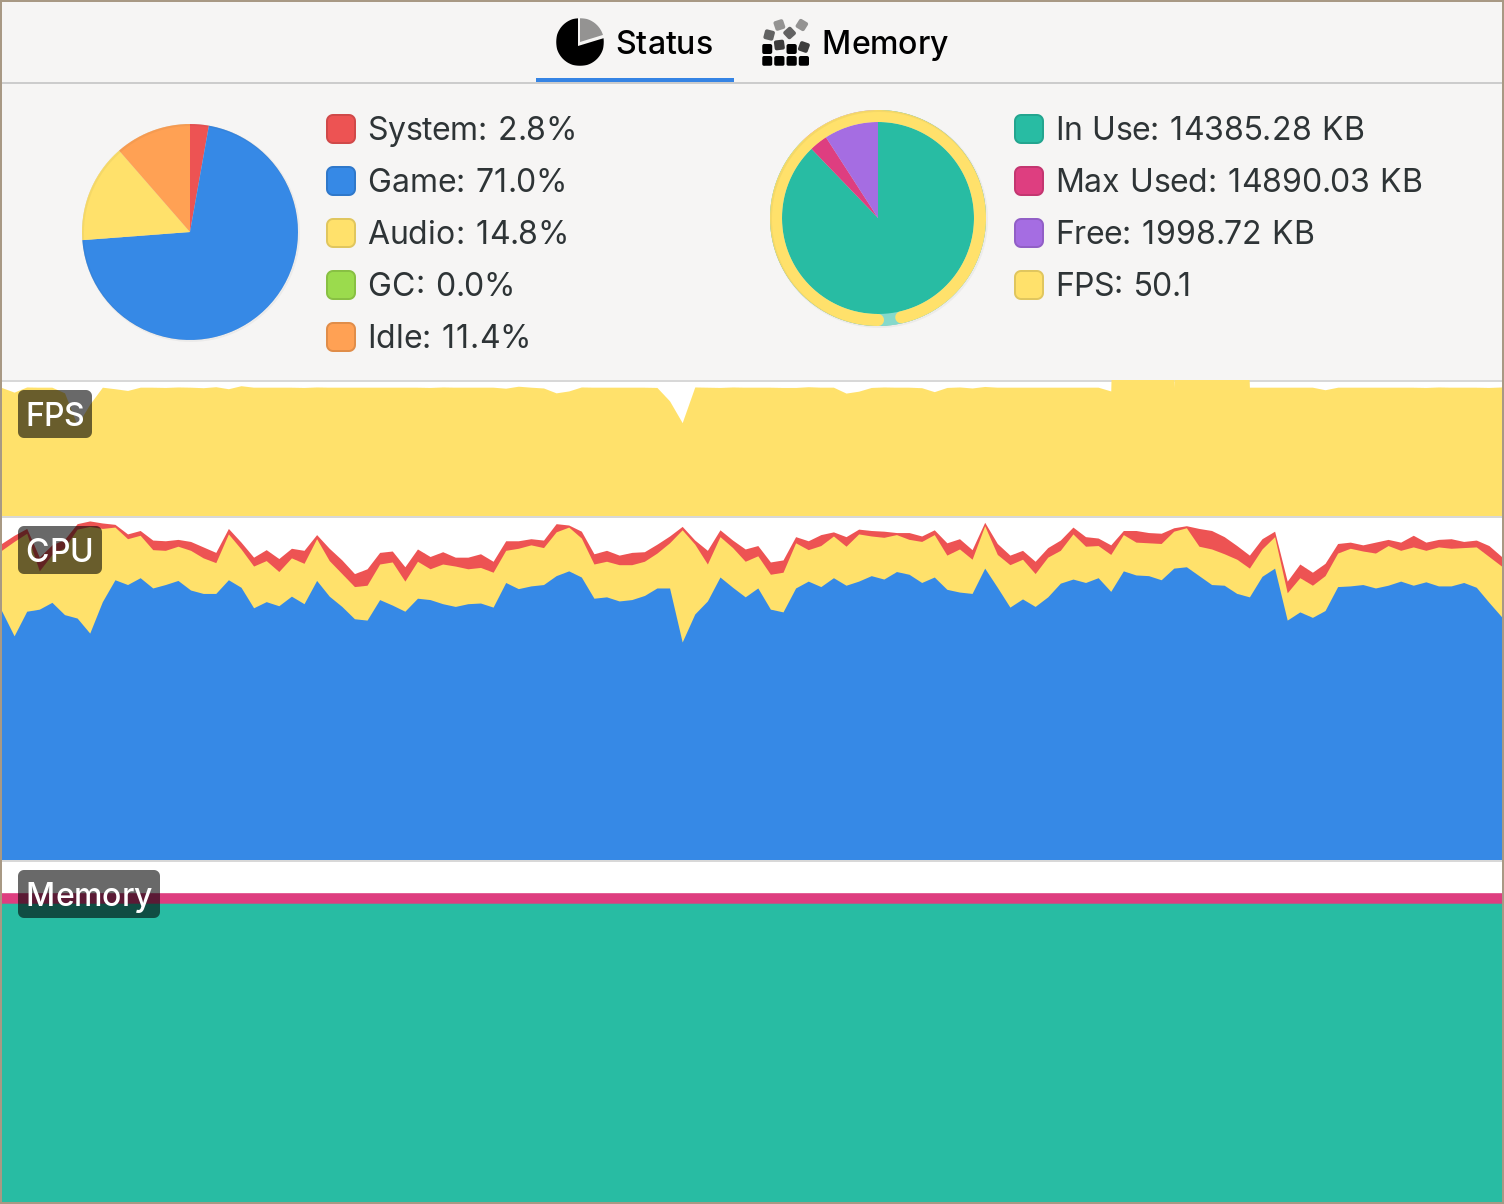
One thing I was afraid of when I started working on this game was profiling code. By the end of Pullfrog Deluxe development, I tried using the SDK profiler, but I had a really hard time.

The call stack in general was big, and it wasn't clear for me which things were the ones I had control over.
So when we started working on the pinball, I prioritized an easy way to measure performance.
Reading the Playdate dev forum, I learned that if you were doing things in C, you couldn't use the simulator profiler on desktop, just on device. Even the device profiling wasn't that great. But you could use any of the profilers for desktop apps.
I remembered there was a profiler project from the Hand Made community that sounded interesting, so I started looking into it.
The project name is Spall and to my delight, integrating the tracing library was super simple. The library is a single header file; you include it in your project and add a couple of macros to the functions you want to trace.

This was different from my previous approach in Pullfrog where I started with the full code being profiled and got lost quickly because it was hard to tell what was happening. You can profile specific functions using the Lua SDK, but you would still get all the other functions in the data.
But the thing that made the biggest difference was the overall UI/UX of Spall. You can zoom in and out, and pan the graph smoothly, whereas in the Playdate SDK you have to first select a section of the timeline and then view that profiling info.

Another big benefit from Spall is that they have a free web version, so you can try it out and see if it works for you.
I even managed to generate the Spall profiling data on the device! It was not perfect; the device would stall after the ring buffer was full and needed to write to disk, but it was enough for me to test small code paths.
At the end, my setup wasn't perfect, but just learning how to interpret the data was enough for me. I learned that a good UI takes you a long way into understanding something complex and scary.
I'm thinking of dropping Spall, at least for device profiling. Now that I actually understand what's happening, I feel more confident to use any profiler.
I also wanted to try Tracy, but after reading the documentation, it seemed that I needed to get a C++ build system, and my build system is super simple. So it didn't seem worth it for this project.
One thing that got me excited is that Superluminal is coming to Linux. Sounds like the next year could be the year of the Linux desktop!
Well, it seems that all the people who talked about profiling were right, it's really useful! And after years of using print statements to debug, I started to wonder... Is this the time to learn how to actually use a debugger?.
See you in the next adventure, The Debugger.






Comments